First steps
[1]:
import sisl
# We define the root directory where our files are
siesta_files = sisl._environ.get_environ_variable("SISL_FILES_TESTS") / "sisl" / "io" / "siesta"
Activating the viz framework
The first thing you will need to do in order to use plots is to import sisl.viz:
[2]:
import sisl.viz
from sisl.viz import Plot
This will load the appropiate things into sisl to use the visualization tools. You can also control the loading of the framework with an environment variable:
SISL_VIZ_AUTOLOAD=True
will load the framework on import sisl, so you won’t need to explicitly import it.
Note
If you use sisl to run high performance calculations where you initialize sisl frequently it’s better to have the autoloading turned off (default), as it might introduce an overhead of about a second.
Now that the framework has been loaded, we can start plotting!
My first plots
The most straightforward way to plot things in sisl is to call the Plot class, which you can import as shown in the next cell:
[3]:
from sisl.viz import Plot

Plot(siesta_files / "SrTiO3.bands")
info:0: SislInfo: The plot has been initialized correctly, but the current settings were not enough to generate the figure.
Error: Could not read or generate data for BandsPlot from any of the possible sources.
Here are the errors for each source:
        - bands file: FileNotFoundError.[Errno 2] No such file or directory: '_THIS_DIRECTORY_DOES_NOT_EXIST_/sisl/io/siesta/SrTiO3.bands'
        - aiida bands: AttributeError.'NoneType' object has no attribute '_get_bandplot_data'
        - wfsx file: TypeError.expected str, bytes or os.PathLike object, not NoneType
        - band structure: ValueError.No band structure (k points path) was provided
'<sisl.viz.plots.bands.BandsPlot object at 0x7fec4407abc0>'
Note how we just passed the path to our bands file and sisl recognized what was the plot that we wanted to generate.
Let’s try now passing a .RHO file to check the electronic density:
[4]:
Plot(siesta_files / "SrTiO3.RHO", axes="xy", nsc=[2,1,1], zsmooth='best')
info:0: SislInfo: The plot has been initialized correctly, but the current settings were not enough to generate the figure.
Error: Could not read or generate data for GridPlot from any of the possible sources.
Here are the errors for each source:
        - grid: ValueError.grid was not set
        - grid file: SileError.rhoSileSiesta(SrTiO3.RHO, base=_THIS_DIRECTORY_DOES_NOT_EXIST_/sisl/io/siesta).read_grid_size could not read grid sizes. (ierr=2)
'<sisl.viz.plots.grid.GridPlot object at 0x7fec0f6b25c0>'
You probably noticed that we used some extra arguments (axes, nsc, zsmooth) to get the exact plot that we wanted. These arguments are called settings. Settings define how the plot will process and show your plot. You can provide settings on initialization or update them later.
Plot() returns a plot object. If you want to keep that plot object for later (to do any modification on it) you will have to, of course, store it in a variable. Let’s do that:
[5]:
rho_plot = Plot(siesta_files / "SrTiO3.RHO", axes="xy", nsc=[2,1,1], zsmooth="best")
info:0: SislInfo: The plot has been initialized correctly, but the current settings were not enough to generate the figure.
Error: Could not read or generate data for GridPlot from any of the possible sources.
Here are the errors for each source:
        - grid: ValueError.grid was not set
        - grid file: SileError.rhoSileSiesta(SrTiO3.RHO, base=_THIS_DIRECTORY_DOES_NOT_EXIST_/sisl/io/siesta).read_grid_size could not read grid sizes. (ierr=2)
And now that we have it, let’s try to get some help from it to understand the plot object better.
[6]:
print(rho_plot.__class__)
print(rho_plot.__doc__)
<class 'sisl.viz.plots.grid.GridPlot'>

    Versatile visualization tool for any kind of grid.

    Parameters
    ------------
    grid: Grid, optional
        A sisl.Grid object. If provided, grid_file is ignored.
    grid_file: cubeSile or rhoSileSiesta or ldosSileSiesta or rhoinitSileSiesta or rhoxcSileSiesta or drhoSileSiesta or baderSileSiesta or iorhoSileSiesta or totalrhoSileSiesta or stsSileSiesta or stmldosSileSiesta or hartreeSileSiesta or neutralatomhartreeSileSiesta or totalhartreeSileSiesta or gridncSileSiesta or ncSileSiesta or fdfSileSiesta or tsvncSileSiesta or chgSileVASP or locpotSileVASP, optional
        A filename that can be return a Grid through `read_grid`.
    represent:  optional
        The representation of the grid that should be displayed
    transforms:  optional
        Transformations to apply to the whole grid.             It can be a
        function, or a string that represents the path             to a
        function (e.g. "scipy.exp"). If a string that is a single
        word is provided, numpy will be assumed to be the module (e.g.
        "square" will be converted into "np.square").              Note that
        transformations will be applied in the order provided. Some
        transforms might not be necessarily commutable (e.g. "abs" and
        "cos").
    axes:  optional
        The axis along you want to see the grid, it will be reduced along the
        other ones, according to the the `reduce_method` setting.
    zsmooth:  optional
        Parameter that smoothens how data looks in a heatmap.
        'best' interpolates data, 'fast' interpolates pixels, 'False'
        displays the data as is.
    interp: array-like, optional
        Interpolation factors to make the grid finer on each axis.See the
        zsmooth setting for faster smoothing of 2D heatmap.
    transform_bc:  optional
        The boundary conditions when a cell transform is applied to the grid.
        Cell transforms are only             applied when the grid's cell
        doesn't follow the cartesian coordinates and the requested display is
        2D or 1D.
    nsc: array-like, optional
        Number of times the grid should be repeated
    offset: array-like, optional
        The offset of the grid along each axis. This is important if you are
        planning to match this grid with other geometry related plots.
    trace_name: str, optional
        The name that the trace will show in the legend. Good when merging
        with other plots to be able to toggle the trace in the legend
    x_range: array-like of shape (2,), optional
        Range where the X is displayed. Should be inside the unit cell,
        otherwise it will fail.
    y_range: array-like of shape (2,), optional
        Range where the Y is displayed. Should be inside the unit cell,
        otherwise it will fail.
    z_range: array-like of shape (2,), optional
        Range where the Z is displayed. Should be inside the unit cell,
        otherwise it will fail.
    crange: array-like of shape (2,), optional
        The range of values that the colorbar must enclose. This controls
        saturation and hides below threshold values.
    cmid: int, optional
        The value to set at the center of the colorbar. If not provided, the
        color range is used
    colorscale: str, optional
        A valid plotly colorscale. See https://plotly.com/python/colorscales/
    reduce_method:  optional
        The method used to reduce the dimensions that will not be displayed
        in the plot.
    isos: array-like of dict, optional
        The isovalues that you want to represent.             The way they
        will be represented is of course dependant on the type of
        representation:                 - 2D representations: A contour (i.e.
        a line)                 - 3D representations: A surface
        Each item is a dict.    Structure of the dict: {         'name': The
        name of the iso query. Note that you can use $isoval$ as a template
        to indicate where the isoval should go.         'val': The iso value.
        If not provided, it will be infered from `frac`         'frac': If
        val is not provided, this is used to calculate where the isosurface
        should be drawn.                     It calculates them from the
        minimum and maximum values of the grid like so:
        If iso_frac = 0.3:                     (min_value-----
        ISOVALUE(30%)-----------max_value)                     Therefore, it
        should be a number between 0 and 1.
        'step_size': The step size to use to calculate the isosurface in case
        it's a 3D representation                     A bigger step-size can
        speed up the process dramatically, specially the rendering part
        and the resolution may still be more than satisfactory (try to use
        step_size=2). For very big                     grids your computer
        may not even be able to render very fine surfaces, so it's worth
        keeping                     this setting in mind.         'color':
        The color of the surface/contour.         'opacity': Opacity of the
        surface/contour. Between 0 (transparent) and 1 (opaque). }
    plot_geom: bool, optional
        If True the geometry associated to the grid will also be plotted
    geom_kwargs: dict, optional
        Extra arguments that are passed to geom.plot() if plot_geom is set to
        True
    root_fdf: fdfSileSiesta, optional
        Path to the fdf file that is the 'parent' of the results.
    results_path: str, optional
        Directory where the files with the simulations results are
        located. This path has to be relative to the root fdf.
    entry_points_order: array-like, optional
        Order with which entry points will be attempted.
    backend:  optional
        Directory where the files with the simulations results are
        located. This path has to be relative to the root fdf.
We can see two interesting things:
Our plot is a
GridPlot, not simply aPlot. This means that it knows you are dealing with a grid and consequently it will help you by providing useful methods and settings.On the documentation, under
Parameters, you can see the arguments that this plot understands. If you’ve guessed these are the so-called settings, then you’ve guessed right! A way to know the current settings of your plot is to check thesettingsattribute:
[7]:
rho_plot.settings
[7]:
{'grid': None,
 'grid_file': <sisl.io.siesta.binaries.rhoSileSiesta at 0x7fec0f1f2d10>,
 'represent': 'real',
 'transforms': [],
 'axes': 'xy',
 'zsmooth': 'best',
 'interp': [1, 1, 1],
 'transform_bc': 'wrap',
 'nsc': [2, 1, 1],
 'offset': [0, 0, 0],
 'trace_name': None,
 'x_range': None,
 'y_range': None,
 'z_range': None,
 'crange': [None, None],
 'cmid': None,
 'colorscale': None,
 'reduce_method': 'average',
 'isos': [],
 'plot_geom': False,
 'geom_kwargs': {},
 'root_fdf': None,
 'results_path': '',
 'entry_points_order': ['grid', 'grid file'],
 'backend': 'plotly'}
The names might already give you a quick intuition of what each setting does, but for more detail you can go to the documentation. The showcase notebooks show examples and are designed to help you understand what each setting does in a visual way. It is always worth checking them out if you are dealing with a new plot type!
One of the interesting methods that grid plots have is the scan method. Here we use it to do a simple scan of 15 steps with the default settings, but you can play with it:
[8]:
rho_plot.scan(along="z", num=15)
---------------------------------------------------------------------------
AttributeError                            Traceback (most recent call last)
Input In [8], in <cell line: 1>()
----> 1 rho_plot.scan(along="z", num=15)

File ~/checkouts/readthedocs.org/user_builds/sisl/checkouts/v0.12.2/sisl/viz/plots/grid.py:1068, in GridPlot.scan(self, along, start, stop, step, num, breakpoints, mode, animation_kwargs, **kwargs)
   1065 if mode == "as_is" and set(axes) - set(["x", "y", "z"]):
   1066     raise ValueError("To perform a scan, the axes need to be cartesian. Please set the axes to a combination of 'x', 'y' and 'z'.")
-> 1068 if self.grid.sc.is_cartesian():
   1069     grid = self.grid
   1070 else:

AttributeError: 'NoneType' object has no attribute 'sc'
Plotable objects
In this section we’d like to point out that using the Plot class is not the most convenient thing for day to day usage. Instead, everything that is plotable in sisl will receive a plot method that you can use. One example of a plotable object is the bandsSileSiesta:
[9]:
bands_sile = sisl.get_sile(siesta_files/"SrTiO3.bands")
bands_sile.plot()
info:0: SislInfo: The plot has been initialized correctly, but the current settings were not enough to generate the figure.
Error: Could not read or generate data for BandsPlot from any of the possible sources.
Here are the errors for each source:
        - bands file: FileNotFoundError.[Errno 2] No such file or directory: '_THIS_DIRECTORY_DOES_NOT_EXIST_/sisl/io/siesta/SrTiO3.bands'
        - aiida bands: AttributeError.'NoneType' object has no attribute '_get_bandplot_data'
        - wfsx file: TypeError.expected str, bytes or os.PathLike object, not NoneType
        - band structure: ValueError.No band structure (k points path) was provided
'<sisl.viz.plots.bands.BandsPlot object at 0x7fec4405a140>'
Although the plot attribute is not exactly a method, but a manager that organizes all the plotting possibilities for an object. If you call it, as we did, you get the default plot, but you can specify which plot type you want specifically:
[10]:
bands_sile.plot.bands(bands_color="red")
info:0: SislInfo: The plot has been initialized correctly, but the current settings were not enough to generate the figure.
Error: Could not read or generate data for BandsPlot from any of the possible sources.
Here are the errors for each source:
        - bands file: FileNotFoundError.[Errno 2] No such file or directory: '_THIS_DIRECTORY_DOES_NOT_EXIST_/sisl/io/siesta/SrTiO3.bands'
        - aiida bands: AttributeError.'NoneType' object has no attribute '_get_bandplot_data'
        - wfsx file: TypeError.expected str, bytes or os.PathLike object, not NoneType
        - band structure: ValueError.No band structure (k points path) was provided
'<sisl.viz.plots.bands.BandsPlot object at 0x7fec0f010cd0>'
One can quickly check what are the options:
[11]:
dir(bands_sile.plot)
[11]:
['bands', 'fatbands', 'register', 'renew']
And you then see that there’s the option to plot the fatbands from this object. We won’t do it here because it needs the .WFSX file, which we don’t have.
Updating your plots
As we mentioned earlier, plots have settings and they can be updated. This stems from the fact that the framework is designed with GUIs in mind, where the user will have visual input fields that they may tweak to see how the plot changes. So you might do as if you were interacting from a GUI and update the settings:
[12]:
rho_plot.update_settings(z_range=[1, 3], axes="xyz", isos=[{"frac": 0.05, "color":"lightgreen", "opacity": 0.3}])
---------------------------------------------------------------------------
AttributeError                            Traceback (most recent call last)
Input In [12], in <cell line: 1>()
----> 1 rho_plot.update_settings(z_range=[1, 3], axes="xyz", isos=[{"frac": 0.05, "color":"lightgreen", "opacity": 0.3}])

File ~/checkouts/readthedocs.org/user_builds/sisl/checkouts/v0.12.2/sisl/viz/configurable.py:440, in ConfigurableMeta.__new__.<locals>.update_settings(self, *args, **kwargs)
    439 def update_settings(self, *args, **kwargs):
--> 440     return self._update_settings(*args, **kwargs)

File ~/checkouts/readthedocs.org/user_builds/sisl/checkouts/v0.12.2/sisl/viz/configurable.py:561, in Configurable._update_settings(self, run_updates, **kwargs)
    559     #Do things after updating the settings
    560     if len(self.settings_history.last_updated) > 0 and run_updates:
--> 561         self._run_updates(self.settings_history.last_updated)
    563 return self

File ~/checkouts/readthedocs.org/user_builds/sisl/checkouts/v0.12.2/sisl/viz/configurable.py:589, in Configurable._run_updates(self, for_keys)
    587 # Execute the functions that we need to execute.
    588 for f_name in func_names:
--> 589     getattr(self, f_name)()
    591 return self

File ~/checkouts/readthedocs.org/user_builds/sisl/checkouts/v0.12.2/sisl/viz/plotutils.py:829, in repeat_if_children.<locals>.apply_to_all_plots(obj, children_sel, *args, **kwargs)
    825     obj.get_figure()
    827 else:
--> 829     return method(obj, *args, **kwargs)

File ~/checkouts/readthedocs.org/user_builds/sisl/checkouts/v0.12.2/sisl/viz/configurable.py:891, in vizplotly_settings.<locals>.decorator.<locals>.func(obj, *args, **kwargs)
    888 @wraps(method)
    889 def func(obj, *args, **kwargs):
    890     getattr(obj, method_name)(**kwargs, **extra_kwargs)
--> 891     return method(obj, *args, **kwargs)

File ~/checkouts/readthedocs.org/user_builds/sisl/checkouts/v0.12.2/sisl/viz/plot.py:1108, in Plot.set_data(self, update_fig, **kwargs)
   1100 @repeat_if_children
   1101 @vizplotly_settings('before')
   1102 def set_data(self, update_fig = True, **kwargs):
   1103     """ Method to process the data that has been read beforehand by read_data() and prepare the figure
   1104
   1105     If everything is succesful, it calls the next step in plotting (`get_figure`)
   1106     """
-> 1108     self._for_backend = self._set_data()
   1110     if update_fig:
   1111         self.get_figure()

File ~/checkouts/readthedocs.org/user_builds/sisl/checkouts/v0.12.2/sisl/viz/configurable.py:972, in _populate_with_settings.<locals>.f_default_setting_args(self, *args, **kwargs)
    969         except KeyError:
    970             pass
--> 972 return f(self, *args, **kwargs)

File ~/checkouts/readthedocs.org/user_builds/sisl/checkouts/v0.12.2/sisl/viz/plots/grid.py:530, in GridPlot._set_data(self, axes, nsc, interp, trace_name, transforms, represent, grid_file, x_range, y_range, z_range, plot_geom, geom_kwargs, transform_bc, reduce_method)
    527 if trace_name is None and grid_file:
    528     trace_name = grid_file.name
--> 530 grid = self.grid.copy()
    532 self._ndim = len(axes)
    533 self.offsets["origin"] = grid.origin

AttributeError: 'NoneType' object has no attribute 'copy'
The most important thing is that, by the time we do this update, the .RHO file could have changed its location or even disappeared and it wouldn’t matter. When you update a setting, the plot reruns only from the point where that setting is used. This avoids rerunning time-consuming initializations like reading a very big file or diagonalizing a hamiltonian.
However, this is not the only useful point. Since plots are self-contained, you can share this plot with someone else and they will be able to tweak all the settings that they wish if they don’t involve reading data again. Isn’t this nice? This brings us to the next section.
Storing and loading plots
After a time-consuming calculation or data reading, you clearly want your results to be saved. Plots provide a save method:
[13]:
rho_plot.save("rho_plot.plot")
[13]:
True
As discussed in the last paragraph of the previous section this stores not only the current visualization, but the full self contained plot that you can tweak as you wish when you load it again:
[14]:
rho_plot_from_colleague = sisl.viz.load("rho_plot.plot")
And do whatever you want with it:
[15]:
rho_plot_from_colleague.update_settings(axes="x")
---------------------------------------------------------------------------
AttributeError                            Traceback (most recent call last)
Input In [15], in <cell line: 1>()
----> 1 rho_plot_from_colleague.update_settings(axes="x")

File ~/checkouts/readthedocs.org/user_builds/sisl/checkouts/v0.12.2/sisl/viz/configurable.py:440, in ConfigurableMeta.__new__.<locals>.update_settings(self, *args, **kwargs)
    439 def update_settings(self, *args, **kwargs):
--> 440     return self._update_settings(*args, **kwargs)

File ~/checkouts/readthedocs.org/user_builds/sisl/checkouts/v0.12.2/sisl/viz/configurable.py:561, in Configurable._update_settings(self, run_updates, **kwargs)
    559     #Do things after updating the settings
    560     if len(self.settings_history.last_updated) > 0 and run_updates:
--> 561         self._run_updates(self.settings_history.last_updated)
    563 return self

File ~/checkouts/readthedocs.org/user_builds/sisl/checkouts/v0.12.2/sisl/viz/configurable.py:589, in Configurable._run_updates(self, for_keys)
    587 # Execute the functions that we need to execute.
    588 for f_name in func_names:
--> 589     getattr(self, f_name)()
    591 return self

File ~/checkouts/readthedocs.org/user_builds/sisl/checkouts/v0.12.2/sisl/viz/plotutils.py:829, in repeat_if_children.<locals>.apply_to_all_plots(obj, children_sel, *args, **kwargs)
    825     obj.get_figure()
    827 else:
--> 829     return method(obj, *args, **kwargs)

File ~/checkouts/readthedocs.org/user_builds/sisl/checkouts/v0.12.2/sisl/viz/configurable.py:891, in vizplotly_settings.<locals>.decorator.<locals>.func(obj, *args, **kwargs)
    888 @wraps(method)
    889 def func(obj, *args, **kwargs):
    890     getattr(obj, method_name)(**kwargs, **extra_kwargs)
--> 891     return method(obj, *args, **kwargs)

File ~/checkouts/readthedocs.org/user_builds/sisl/checkouts/v0.12.2/sisl/viz/plot.py:1108, in Plot.set_data(self, update_fig, **kwargs)
   1100 @repeat_if_children
   1101 @vizplotly_settings('before')
   1102 def set_data(self, update_fig = True, **kwargs):
   1103     """ Method to process the data that has been read beforehand by read_data() and prepare the figure
   1104
   1105     If everything is succesful, it calls the next step in plotting (`get_figure`)
   1106     """
-> 1108     self._for_backend = self._set_data()
   1110     if update_fig:
   1111         self.get_figure()

File ~/checkouts/readthedocs.org/user_builds/sisl/checkouts/v0.12.2/sisl/viz/configurable.py:972, in _populate_with_settings.<locals>.f_default_setting_args(self, *args, **kwargs)
    969         except KeyError:
    970             pass
--> 972 return f(self, *args, **kwargs)

File ~/checkouts/readthedocs.org/user_builds/sisl/checkouts/v0.12.2/sisl/viz/plots/grid.py:530, in GridPlot._set_data(self, axes, nsc, interp, trace_name, transforms, represent, grid_file, x_range, y_range, z_range, plot_geom, geom_kwargs, transform_bc, reduce_method)
    527 if trace_name is None and grid_file:
    528     trace_name = grid_file.name
--> 530 grid = self.grid.copy()
    532 self._ndim = len(axes)
    533 self.offsets["origin"] = grid.origin

AttributeError: 'NoneType' object has no attribute 'copy'
[16]:
# Let's clean the working directory.
import os
os.remove("rho_plot.plot")
You might ask yourself now what happens if you just want to store the representation, not the full self-contained plot. For this, we first need to discuss the next section.
Different plotting backends
Hidden between all the settings, you can find a very special setting: backend.
Initially, the visualization framework was written to plot things using plotly. However, we noticed that this might not be the appropiate choice for everyone. Therefore, we changed the design to make it very modular and allow rendering the plot with any framework you like. There’s a dedicated notebook on how to register your own backends. Here however we just want to show you how you can switch between the sisl-provided backends. It is very simple:
[17]:
rho_plot_from_colleague.update_settings(backend="matplotlib", axes="x")
---------------------------------------------------------------------------
TypeError                                 Traceback (most recent call last)
Input In [17], in <cell line: 1>()
----> 1 rho_plot_from_colleague.update_settings(backend="matplotlib", axes="x")

File ~/checkouts/readthedocs.org/user_builds/sisl/checkouts/v0.12.2/sisl/viz/configurable.py:440, in ConfigurableMeta.__new__.<locals>.update_settings(self, *args, **kwargs)
    439 def update_settings(self, *args, **kwargs):
--> 440     return self._update_settings(*args, **kwargs)

File ~/checkouts/readthedocs.org/user_builds/sisl/checkouts/v0.12.2/sisl/viz/configurable.py:561, in Configurable._update_settings(self, run_updates, **kwargs)
    559     #Do things after updating the settings
    560     if len(self.settings_history.last_updated) > 0 and run_updates:
--> 561         self._run_updates(self.settings_history.last_updated)
    563 return self

File ~/checkouts/readthedocs.org/user_builds/sisl/checkouts/v0.12.2/sisl/viz/configurable.py:589, in Configurable._run_updates(self, for_keys)
    587 # Execute the functions that we need to execute.
    588 for f_name in func_names:
--> 589     getattr(self, f_name)()
    591 return self

File ~/checkouts/readthedocs.org/user_builds/sisl/checkouts/v0.12.2/sisl/viz/configurable.py:972, in _populate_with_settings.<locals>.f_default_setting_args(self, *args, **kwargs)
    969         except KeyError:
    970             pass
--> 972 return f(self, *args, **kwargs)

File ~/checkouts/readthedocs.org/user_builds/sisl/checkouts/v0.12.2/sisl/viz/plot.py:1140, in Plot.get_figure(self, backend, clear_fig, **kwargs)
   1136 if clear_fig:
   1137     # Clear all the traces from the figure before drawing the new ones
   1138     self.clear()
-> 1140 self.draw(getattr(self, "_for_backend", None))
   1142 call_method_if_present(self, '_after_get_figure')
   1144 call_method_if_present(self, 'on_figure_change')

File ~/checkouts/readthedocs.org/user_builds/sisl/checkouts/v0.12.2/sisl/viz/backends/templates/_plots/grid.py:24, in GridBackend.draw(self, backend_info)
     22 def draw(self, backend_info):
     23     # Choose which function we need to use to plot
---> 24     drawing_func = getattr(self, f"draw_{backend_info['ndim']}D")
     26     drawing_func(backend_info)
     28     if backend_info["geom_plot"] is not None:

TypeError: 'NoneType' object is not subscriptable
[18]:
rho_plot_from_colleague.update_settings(backend="plotly", axes="xy")
---------------------------------------------------------------------------
AttributeError                            Traceback (most recent call last)
Input In [18], in <cell line: 1>()
----> 1 rho_plot_from_colleague.update_settings(backend="plotly", axes="xy")

File ~/checkouts/readthedocs.org/user_builds/sisl/checkouts/v0.12.2/sisl/viz/configurable.py:440, in ConfigurableMeta.__new__.<locals>.update_settings(self, *args, **kwargs)
    439 def update_settings(self, *args, **kwargs):
--> 440     return self._update_settings(*args, **kwargs)

File ~/checkouts/readthedocs.org/user_builds/sisl/checkouts/v0.12.2/sisl/viz/configurable.py:561, in Configurable._update_settings(self, run_updates, **kwargs)
    559     #Do things after updating the settings
    560     if len(self.settings_history.last_updated) > 0 and run_updates:
--> 561         self._run_updates(self.settings_history.last_updated)
    563 return self

File ~/checkouts/readthedocs.org/user_builds/sisl/checkouts/v0.12.2/sisl/viz/configurable.py:589, in Configurable._run_updates(self, for_keys)
    587 # Execute the functions that we need to execute.
    588 for f_name in func_names:
--> 589     getattr(self, f_name)()
    591 return self

File ~/checkouts/readthedocs.org/user_builds/sisl/checkouts/v0.12.2/sisl/viz/plotutils.py:829, in repeat_if_children.<locals>.apply_to_all_plots(obj, children_sel, *args, **kwargs)
    825     obj.get_figure()
    827 else:
--> 829     return method(obj, *args, **kwargs)

File ~/checkouts/readthedocs.org/user_builds/sisl/checkouts/v0.12.2/sisl/viz/configurable.py:891, in vizplotly_settings.<locals>.decorator.<locals>.func(obj, *args, **kwargs)
    888 @wraps(method)
    889 def func(obj, *args, **kwargs):
    890     getattr(obj, method_name)(**kwargs, **extra_kwargs)
--> 891     return method(obj, *args, **kwargs)

File ~/checkouts/readthedocs.org/user_builds/sisl/checkouts/v0.12.2/sisl/viz/plot.py:1108, in Plot.set_data(self, update_fig, **kwargs)
   1100 @repeat_if_children
   1101 @vizplotly_settings('before')
   1102 def set_data(self, update_fig = True, **kwargs):
   1103     """ Method to process the data that has been read beforehand by read_data() and prepare the figure
   1104
   1105     If everything is succesful, it calls the next step in plotting (`get_figure`)
   1106     """
-> 1108     self._for_backend = self._set_data()
   1110     if update_fig:
   1111         self.get_figure()

File ~/checkouts/readthedocs.org/user_builds/sisl/checkouts/v0.12.2/sisl/viz/configurable.py:972, in _populate_with_settings.<locals>.f_default_setting_args(self, *args, **kwargs)
    969         except KeyError:
    970             pass
--> 972 return f(self, *args, **kwargs)

File ~/checkouts/readthedocs.org/user_builds/sisl/checkouts/v0.12.2/sisl/viz/plots/grid.py:530, in GridPlot._set_data(self, axes, nsc, interp, trace_name, transforms, represent, grid_file, x_range, y_range, z_range, plot_geom, geom_kwargs, transform_bc, reduce_method)
    527 if trace_name is None and grid_file:
    528     trace_name = grid_file.name
--> 530 grid = self.grid.copy()
    532 self._ndim = len(axes)
    533 self.offsets["origin"] = grid.origin

AttributeError: 'NoneType' object has no attribute 'copy'
[19]:
rho_plot_from_colleague.update_settings(backend="matplotlib")
---------------------------------------------------------------------------
TypeError                                 Traceback (most recent call last)
Input In [19], in <cell line: 1>()
----> 1 rho_plot_from_colleague.update_settings(backend="matplotlib")

File ~/checkouts/readthedocs.org/user_builds/sisl/checkouts/v0.12.2/sisl/viz/configurable.py:440, in ConfigurableMeta.__new__.<locals>.update_settings(self, *args, **kwargs)
    439 def update_settings(self, *args, **kwargs):
--> 440     return self._update_settings(*args, **kwargs)

File ~/checkouts/readthedocs.org/user_builds/sisl/checkouts/v0.12.2/sisl/viz/configurable.py:561, in Configurable._update_settings(self, run_updates, **kwargs)
    559     #Do things after updating the settings
    560     if len(self.settings_history.last_updated) > 0 and run_updates:
--> 561         self._run_updates(self.settings_history.last_updated)
    563 return self

File ~/checkouts/readthedocs.org/user_builds/sisl/checkouts/v0.12.2/sisl/viz/configurable.py:589, in Configurable._run_updates(self, for_keys)
    587 # Execute the functions that we need to execute.
    588 for f_name in func_names:
--> 589     getattr(self, f_name)()
    591 return self

File ~/checkouts/readthedocs.org/user_builds/sisl/checkouts/v0.12.2/sisl/viz/configurable.py:972, in _populate_with_settings.<locals>.f_default_setting_args(self, *args, **kwargs)
    969         except KeyError:
    970             pass
--> 972 return f(self, *args, **kwargs)

File ~/checkouts/readthedocs.org/user_builds/sisl/checkouts/v0.12.2/sisl/viz/plot.py:1140, in Plot.get_figure(self, backend, clear_fig, **kwargs)
   1136 if clear_fig:
   1137     # Clear all the traces from the figure before drawing the new ones
   1138     self.clear()
-> 1140 self.draw(getattr(self, "_for_backend", None))
   1142 call_method_if_present(self, '_after_get_figure')
   1144 call_method_if_present(self, 'on_figure_change')

File ~/checkouts/readthedocs.org/user_builds/sisl/checkouts/v0.12.2/sisl/viz/backends/templates/_plots/grid.py:24, in GridBackend.draw(self, backend_info)
     22 def draw(self, backend_info):
     23     # Choose which function we need to use to plot
---> 24     drawing_func = getattr(self, f"draw_{backend_info['ndim']}D")
     26     drawing_func(backend_info)
     28     if backend_info["geom_plot"] is not None:

TypeError: 'NoneType' object is not subscriptable
Note that you can always know what backends are available for the plot by checking the options of the backend parameter:
[20]:
rho_plot_from_colleague.get_param("backend").options
[20]:
['plotly', 'matplotlib']
Note that the options here will only show the backends that have been loaded. sisl only loads backends if the required python packages are present. Currently, sisl provides backends for three frameworks: plotly, matplotlib and blender.
If you have one backend selected, you will have available all the methods that the framework provides. For example, if you are using the matplotlib backend, you can use all the methods that matplotlib implements for the Axes object directly on the plot. You also have the figure (axes) under the figure (axes) attribute, for whatever you want to do.
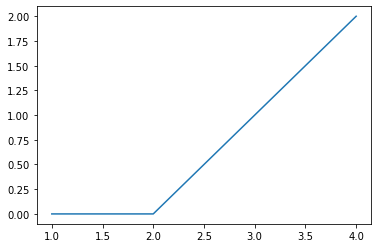
Let’s for example draw a line, using Axes.plot:
[21]:
rho_plot_from_colleague.plot([1,2,3,4], [0,0,1,2])
rho_plot_from_colleague
And now let’s do the same with plotly. In this case, all methods are looked for in the Figure object that is stored under the figure attribute.
[22]:
rho_plot_from_colleague.update_settings(backend="plotly")
rho_plot_from_colleague.add_scatter(x=[1,2,3,4], y=[0,0,1,2])
---------------------------------------------------------------------------
TypeError                                 Traceback (most recent call last)
Input In [22], in <cell line: 1>()
----> 1 rho_plot_from_colleague.update_settings(backend="plotly")
      2 rho_plot_from_colleague.add_scatter(x=[1,2,3,4], y=[0,0,1,2])

File ~/checkouts/readthedocs.org/user_builds/sisl/checkouts/v0.12.2/sisl/viz/configurable.py:440, in ConfigurableMeta.__new__.<locals>.update_settings(self, *args, **kwargs)
    439 def update_settings(self, *args, **kwargs):
--> 440     return self._update_settings(*args, **kwargs)

File ~/checkouts/readthedocs.org/user_builds/sisl/checkouts/v0.12.2/sisl/viz/configurable.py:561, in Configurable._update_settings(self, run_updates, **kwargs)
    559     #Do things after updating the settings
    560     if len(self.settings_history.last_updated) > 0 and run_updates:
--> 561         self._run_updates(self.settings_history.last_updated)
    563 return self

File ~/checkouts/readthedocs.org/user_builds/sisl/checkouts/v0.12.2/sisl/viz/configurable.py:589, in Configurable._run_updates(self, for_keys)
    587 # Execute the functions that we need to execute.
    588 for f_name in func_names:
--> 589     getattr(self, f_name)()
    591 return self

File ~/checkouts/readthedocs.org/user_builds/sisl/checkouts/v0.12.2/sisl/viz/configurable.py:972, in _populate_with_settings.<locals>.f_default_setting_args(self, *args, **kwargs)
    969         except KeyError:
    970             pass
--> 972 return f(self, *args, **kwargs)

File ~/checkouts/readthedocs.org/user_builds/sisl/checkouts/v0.12.2/sisl/viz/plot.py:1140, in Plot.get_figure(self, backend, clear_fig, **kwargs)
   1136 if clear_fig:
   1137     # Clear all the traces from the figure before drawing the new ones
   1138     self.clear()
-> 1140 self.draw(getattr(self, "_for_backend", None))
   1142 call_method_if_present(self, '_after_get_figure')
   1144 call_method_if_present(self, 'on_figure_change')

File ~/checkouts/readthedocs.org/user_builds/sisl/checkouts/v0.12.2/sisl/viz/backends/templates/_plots/grid.py:24, in GridBackend.draw(self, backend_info)
     22 def draw(self, backend_info):
     23     # Choose which function we need to use to plot
---> 24     drawing_func = getattr(self, f"draw_{backend_info['ndim']}D")
     26     drawing_func(backend_info)
     28     if backend_info["geom_plot"] is not None:

TypeError: 'NoneType' object is not subscriptable
At this point, you probably already know how you will be able to save these plots to images, html or whatever other format. Use the methods that each framework provides!
Also, this will also allow you to modify the plot as you wish (adding lines, changing titles, showing legends…) once sisl has render it. Again, you just have to use the methods that the framework provides to do so :)
Discover more
Until here, we have covered the most basic concepts of the framework. If you enjoyed it, we encourage you to check the rest of notebooks to find out about more specific and complex aspects of it.
This next cell is just to create the thumbnail for the notebook in the docs
[23]:
thumbnail_plot = rho_plot_from_colleague

if thumbnail_plot:
    thumbnail_plot.show("png")
---------------------------------------------------------------------------
ValueError                                Traceback (most recent call last)
Input In [23], in <cell line: 3>()
      1 thumbnail_plot = rho_plot_from_colleague
      3 if thumbnail_plot:
----> 4     thumbnail_plot.show("png")

File ~/checkouts/readthedocs.org/user_builds/sisl/checkouts/v0.12.2/sisl/viz/plot.py:1176, in Plot.show(self, listen, return_figWidget, *args, **kwargs)
   1173     except Exception as e:
   1174         warn(e)
-> 1176 return self._backend.show(*args, **kwargs)

File ~/checkouts/readthedocs.org/user_builds/sisl/checkouts/v0.12.2/sisl/viz/backends/plotly/backend.py:42, in PlotlyBackend.show(self, *args, **kwargs)
     41 def show(self, *args, **kwargs):
---> 42     return self.figure.show(*args, **kwargs)

File ~/checkouts/readthedocs.org/user_builds/sisl/conda/v0.12.2/lib/python3.10/site-packages/plotly/basedatatypes.py:3398, in BaseFigure.show(self, *args, **kwargs)
   3365 """
   3366 Show a figure using either the default renderer(s) or the renderer(s)
   3367 specified by the renderer argument
   (...)
   3394 None
   3395 """
   3396 import plotly.io as pio
-> 3398 return pio.show(self, *args, **kwargs)

File ~/checkouts/readthedocs.org/user_builds/sisl/conda/v0.12.2/lib/python3.10/site-packages/plotly/io/_renderers.py:388, in show(fig, renderer, validate, **kwargs)
    385 fig_dict = validate_coerce_fig_to_dict(fig, validate)
    387 # Mimetype renderers
--> 388 bundle = renderers._build_mime_bundle(fig_dict, renderers_string=renderer, **kwargs)
    389 if bundle:
    390     if not ipython_display:

File ~/checkouts/readthedocs.org/user_builds/sisl/conda/v0.12.2/lib/python3.10/site-packages/plotly/io/_renderers.py:296, in RenderersConfig._build_mime_bundle(self, fig_dict, renderers_string, **kwargs)
    293             if hasattr(renderer, k):
    294                 setattr(renderer, k, v)
--> 296         bundle.update(renderer.to_mimebundle(fig_dict))
    298 return bundle

File ~/checkouts/readthedocs.org/user_builds/sisl/conda/v0.12.2/lib/python3.10/site-packages/plotly/io/_base_renderers.py:127, in ImageRenderer.to_mimebundle(self, fig_dict)
    126 def to_mimebundle(self, fig_dict):
--> 127     image_bytes = to_image(
    128         fig_dict,
    129         format=self.format,
    130         width=self.width,
    131         height=self.height,
    132         scale=self.scale,
    133         validate=False,
    134         engine=self.engine,
    135     )
    137     if self.b64_encode:
    138         image_str = base64.b64encode(image_bytes).decode("utf8")

File ~/checkouts/readthedocs.org/user_builds/sisl/conda/v0.12.2/lib/python3.10/site-packages/plotly/io/_kaleido.py:133, in to_image(fig, format, width, height, scale, validate, engine)
    131     # Raise informative error message if Kaleido is not installed
    132     if scope is None:
--> 133         raise ValueError(
    134             """
    135 Image export using the "kaleido" engine requires the kaleido package,
    136 which can be installed using pip:
    137     $ pip install -U kaleido
    138 """
    139         )
    141     # Validate figure
    142     # ---------------
    143     fig_dict = validate_coerce_fig_to_dict(fig, validate)

ValueError:
Image export using the "kaleido" engine requires the kaleido package,
which can be installed using pip:
    $ pip install -U kaleido