Building a new plot
Following this guide, you will create a new plot in no time. Remember to check the introduction notebook to the framework to understand that: - Your plot will support multiple plotting backends. - Your plot will only recompute what is needed when its inputs are updated.
Let’s get started!
The tools
We provide you with a set of tools to create plots. The most basic ones are two of them: get_figure and plot_actions.
[1]:
from sisl.viz import get_figure, plot_actions
They are what support the multibackend framework. Let’s try them out:
[2]:
# We create an action.
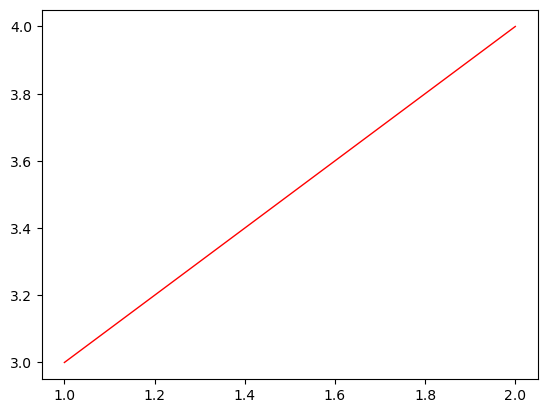
action = plot_actions.draw_line(x=[1, 2], y=[3, 4], line={"color": "red"})

# And then we plot it in a figure
get_figure(backend="plotly", plot_actions=[action])
Simple, isn’t it?
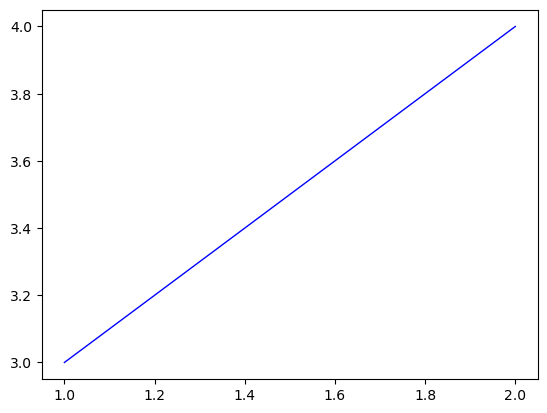
As you might have imagined, we can ask for a matplotlib figure:
[3]:
get_figure(backend="matplotlib", plot_actions=[action])
[3]:
<sisl.viz.figure.matplotlib.MatplotlibFigure at 0x7f8d829f4470>

A plot function
It now feels reasonable to pack this very cool implementation this into a function.
[4]:
def a_cool_plot(color="red", backend="plotly"):
    action = plot_actions.draw_line(x=[1, 2], y=[3, 4], line={"color": color})

    return get_figure(backend=backend, plot_actions=[action])
And just like that, you have your multi framework plot function. It would be a shame to leave it unused.
[5]:
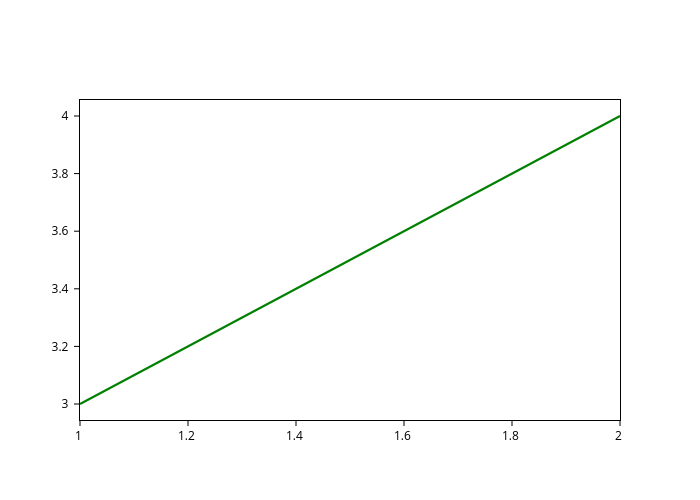
a_cool_plot(color="green")
What is there left to do then? Remember that we wanted our plot to be a workflow, and currently it isn’t.
From function to Plot
To convert our function to a workflow, we need to introduce a new tool, Plot:
[6]:
from sisl.viz import Plot
It is just an extension of sisl’s Workflow class (see sisl.nodes documentation), so creating a Plot from a function is straightforward:
[7]:
CoolPlot = Plot.from_func(a_cool_plot)
Let’s now visualize our workflow!
[8]:
CoolPlot.network.visualize(notebook=True)
There we go, our first multi-backend, updatable Plot :)
Let’s use it:
[9]:
plot = CoolPlot(color="blue")
plot
And now, the moment we’ve all been waiting for. Let’s update our plot:
[10]:
plot.update_inputs(backend="matplotlib")
[10]:
<sisl.nodes.node.a_cool_plot at 0x7f8d808d5bb0>

Additional methods
It might be useful sometimes to provide helper methods so that the users can interact quickly with your plot. E.g. to change inputs or to extract some information from it.
In that case, you’ll just have to define the plot class with class syntax and write the methods as you always do:
[11]:
class CoolPlot(Plot):
    # The function that this workflow will execute
    function = staticmethod(a_cool_plot)

    # Additional methods.
    def color_like(self, object):
        """Uses the latest AI to change the color of the plot matching a given object"""

        color = None
        if object == "sun":
            color = "orange"
        elif object == "grass":
            color = "green"
        else:
            raise ValueError(f"The AI could not determine the color of {color}")

        return self.update_inputs(color=color)
And then you just use it as you would expect:
[12]:
plot = CoolPlot()
plot
[13]:
plot.color_like("grass")
Complex plots
As you probably have noticed, you can go as complex as you wish inside your plot function. If you want to convert it to a Plot however, it is important that you encapsulate sub-functionalities into separate functions so that the workflow doesn’t become to complex, storing useless data and adding too much overhead (this is generic advice for Workflows).
In sisl.viz, you will find plenty of helper functions, specially in sisl.viz.processors, that you might benefit from. You might want to check the already implemented plots in sisl.viz.plots for inspiration.
This next cell is just to create the thumbnail for the notebook in the docs
[14]:
thumbnail_plot = plot

if thumbnail_plot:
    thumbnail_plot.show("png")

[ ]:
