FatbandsPlot
[1]:
import sisl
import sisl.viz
For this notebook we will create a toy “Boron nitride” tight binding:
[2]:
# First, we create the geometry
BN = sisl.geom.graphene(atoms=["B", "N"])

# Create a hamiltonian with different on-site terms
H = sisl.Hamiltonian(BN)

H[0, 0] = 2
H[1, 1] = -2

H[0, 1] = -2.7
H[1, 0] = -2.7

H[0, 1, (-1, 0)] = -2.7
H[0, 1, (0, -1)] = -2.7
H[1, 0, (1, 0)] = -2.7
H[1, 0, (0, 1)] = -2.7
Note that we could have obtained this hamiltonian from any other source. Then we generate a path for the band structure:
[3]:
band = sisl.BandStructure(
    H,
    [[0.0, 0.0], [2.0 / 3, 1.0 / 3], [1.0 / 2, 1.0 / 2], [1.0, 1.0]],
    301,
    [r"Gamma", "K", "M", r"Gamma"],
)
And finally we just ask for the fatbands plot:
[4]:
fatbands = band.plot.fatbands()
fatbands
We only see the bands here, but this is a fatbands plot, and it is ready to accept your requests on what to draw!
Requesting specific weights
The fatbands that the plot draws are controlled by the groups setting. This setting works exactly like the groups setting in PdosPlot, which is documented here. Therefore we won’t give an extended description of it, but just quickly show that you can autogenerate the groups:
[5]:
fatbands.split_orbs(on="species", name="$species")
Or write them yourself if you want the maximum flexibility:
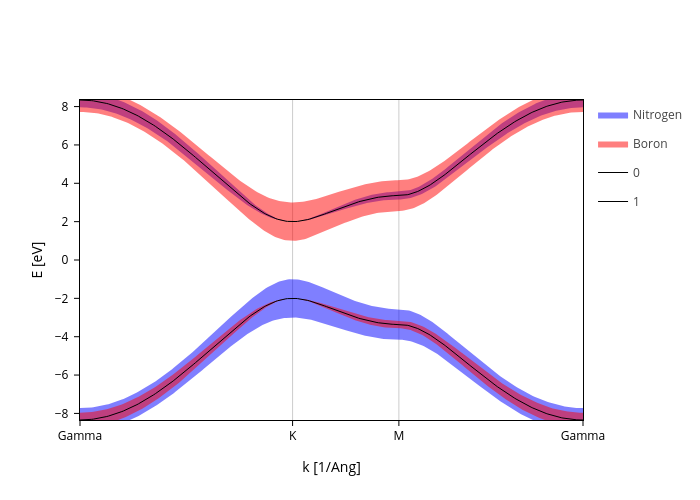
[6]:
fatbands.update_inputs(
    groups=[
        {"species": "N", "color": "blue", "name": "Nitrogen"},
        {"species": "B", "color": "red", "name": "Boron"},
    ]
)
Scaling fatbands
The visual appeal of fatbands depends a lot on the size of your plot, therefore there’s one global scale setting that scales all fatbands at the same time:
[7]:
fatbands.update_inputs(fatbands_scale=2)
Use BandsPlot settings
All settings of BandsPlot work as well for FatbandsPlot.
We hope you enjoyed what you learned!
This next cell is just to create the thumbnail for the notebook in the docs
[8]:
thumbnail_plot = fatbands

if thumbnail_plot:
    thumbnail_plot.show("png")