SitesPlot
The SitesPlot is simply an adaptation of GeometryPlot’s machinery to any class that can be represented as sites in space. The main difference is that it doesn’t show bonds, and also inputs with the word atoms are renamed to sites. Therefore, see GeometryPlot’s showcase notebook to understand the full customization possibilities.
We are just going to show how you can plot the k points of a BrillouinZone object with it.
[1]:
import sisl
import numpy as np
info:0: SislInfo: Please install tqdm (pip install tqdm) for better looking progress bars
Let’s create a circle of K points:
[2]:
g = sisl.geom.graphene()

# Create the circle
bz = sisl.BrillouinZone.param_circle(
    g, kR=0.0085, origin=[0.0, 0.0, 0.0], normal=[0.0, 0.0, 1.0], N_or_dk=25, loop=True
)
And then generate some fake vectorial data for it:
[3]:
data = np.zeros((len(bz), 3))

data[:, 0] = -bz.k[:, 1]
data[:, 1] = bz.k[:, 0]
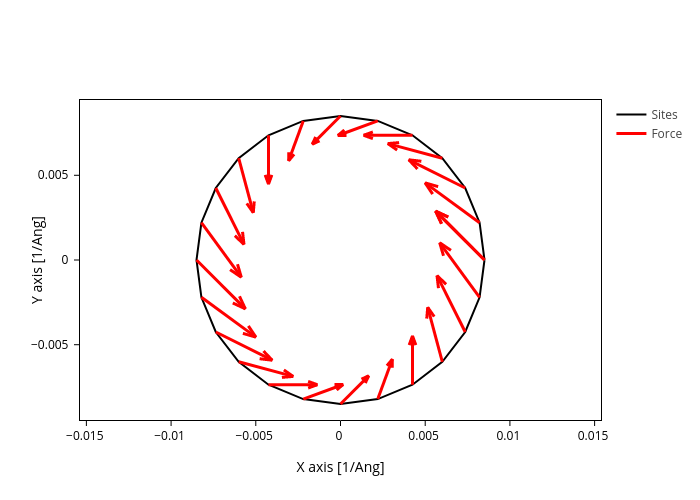
And now plot the k points, showing the vectorial data as arrows:
[4]:
# Plot k points as sites
bz.plot.sites(
    axes="xy",
    drawing_mode="line",
    sites_style={"color": "black", "size": 2},
    arrows={"data": data, "color": "red", "width": 3, "name": "Force"},
).show("png")